
Find hidden HVAC waste in Saudi commercial and industrial buildings with BMS telemetry, IoT sensors, and high-performance control sequences before spending capital budgets on unnecessary equipment replacement.
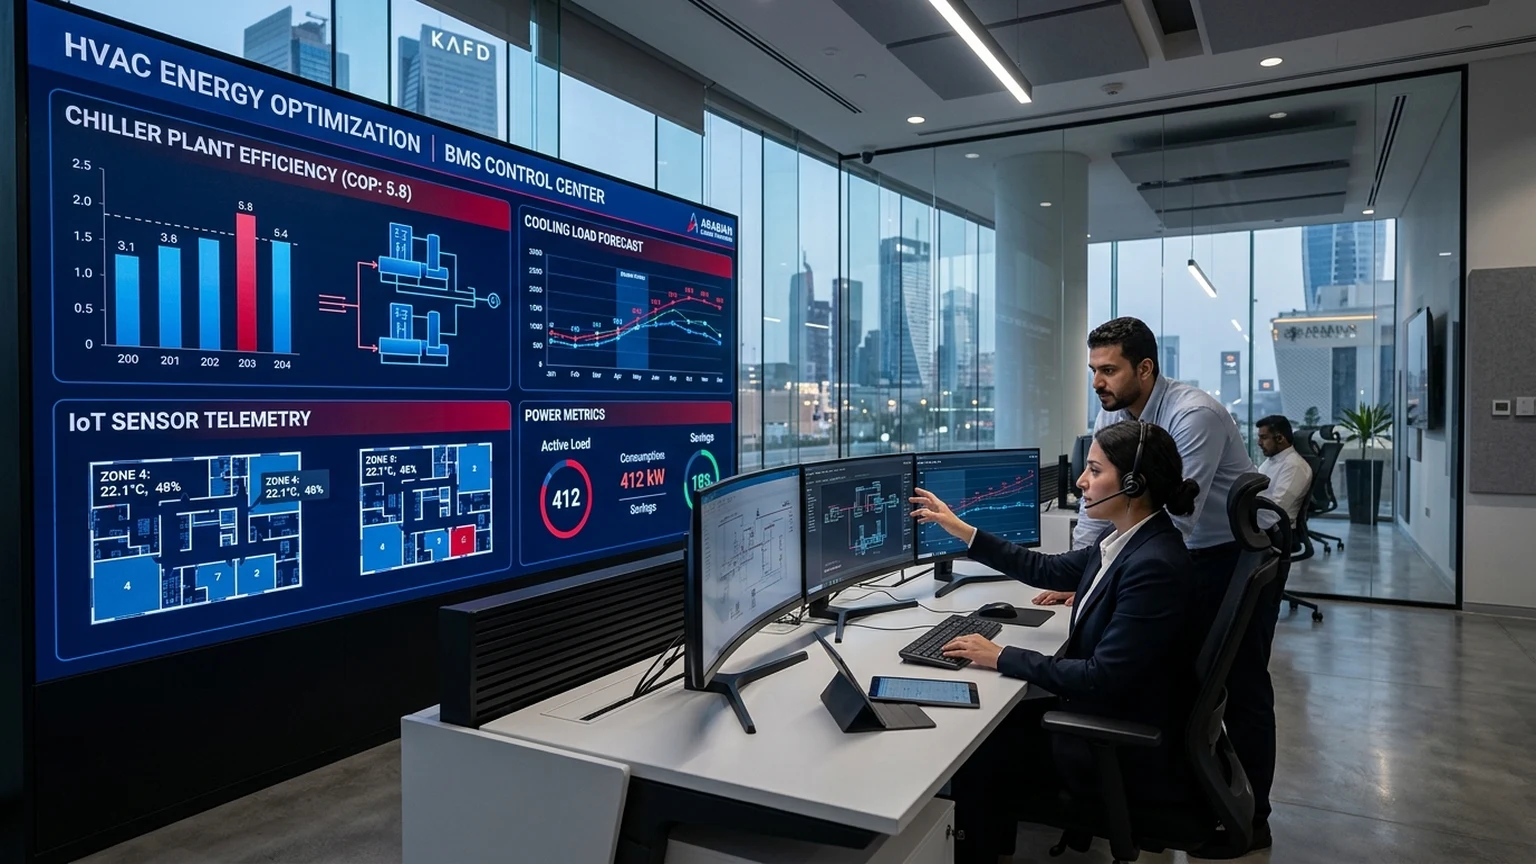
Typical operational cooling waste identified through telemetry without replacing hardware.
Common un-optimized chiller plant efficiency measured across Saudi commercial facilities.
Capital payback period for software-driven fault detection and sensor recalibration.
Initial capital expenditure needed to identify operational drift and sensor bias.
In Saudi commercial facilities, high energy bills are rarely solved by simply replacing chillers, rooftop units, or AHUs with higher-rated nameplate equipment. Over 70% of energy waste occurs in the operational gap—uncalibrated sensors, simultaneous heating and cooling, aggressive schedule drift, and defeated control loops. Building owners must audit controls and telemetry before executing CapEx replacements.
Before approving a multi-million-Riyal equipment replacement RFP, building owners and facility heads should demand rigorous engineering answers to these eight diagnostic points:
What is the measured seasonal kilowatt-per-ton (kW/TR) of your central cooling plant versus manufacturer nameplate design under 45°C ambient conditions?
Is your chilled water return temperature falling below 6°C at partial load, starving the plant of flow and forcing extra chillers online?
Are primary AHU supply fans, secondary booster pumps, and packaged DX compressors running at 100% capacity hours after tenants depart?
Are perimeter VAV terminal reheat coils actively counteracting chilled air supplied by central air handling units in transitional shoulder seasons?
Are particulate-loaded pre-filters and high-efficiency bags forcing backward-curved centrifugal fans to consume 300+ Pa of unneeded static head?
Are stuck minimum outdoor air dampers pulling extreme 46°C humid air directly into conditioned indoor zones well beyond ASHRAE 62.1 requirements?
Are uncalibrated chilled water thermistors or suction pressure transducers driving variable frequency drives to artificially elevated speeds?
Do your facility control changes provide mathematically verifiable kilowatt-hour reductions measured according to Option C energy baselines?
The most common error enterprise building operators commit when embarking on an “AI energy optimization” journey is deploying expensive predictive software before establishing a reliable, weather-normalized empirical baseline.
A true engineering baseline correlates instantaneous kilowatt-hour energy demand against the primary physical drivers of cooling load in Saudi Arabia: outdoor dry-bulb temperature, outdoor humidity ratio (wet-bulb), solar radiation, and internal occupancy profiles. Advanced regression models normalize consumption against Cooling-Degree Hours (CDH) to establish an indisputable mathematical benchmark.
In our energy audits and retro-commissioning assessments across commercial towers, hospital campuses, and industrial facilities in Saudi Arabia, cooling energy waste repeatedly stems from seven control flaws:
AHUs, primary pumps, and VRF condensing units frequently continue operating on schedules configured years earlier. Offices closing at 17:00 often run cooling plants until 22:00 or 24/7.
When occupants in coastal cities complain that air feels stuffy or clammy, operators instinctively lower thermostat setpoints from 24°C to 19°C. This forces compressors into extreme lift without solving latent moisture.
Air handling units run variable frequency drives at constant 400 Pa static pressure because duct pressure sensors are located too close to fan discharges rather than at 2/3 down the most restrictive run.
Chilled water designed for 5.5°C supply and 12.5°C return frequently operates at 6.0°C supply and 8.5°C return (Delta-T = 2.5°C). The plant runs 3 chillers to satisfy flow when 1 chiller has sufficient cooling capacity.
VAV terminal reheat coils and perimeter radiators fight central air supplies, consuming natural gas or electric resistance power to temper air that was just mechanically chilled.
Outdoor air economizers and ventilation dampers get stuck mechanically in open positions during 48°C dust storms, overwhelming cooling coils with extreme thermal loads.
A supply temperature sensor biased +1.5°C causes central chillers to generate water 1.5°C colder than needed, increasing plant compressor electrical consumption by 8% to 12% continuously.
Automated Fault Detection and Diagnostics software continually evaluates raw building management system telemetry against physics based boundary rules. Rather than waiting for occupant complaints, AFDD identifies anomalies the instant they occur, such as a valve commanding 0% open while temperature sensors reveal chilled water is passing through the coil.
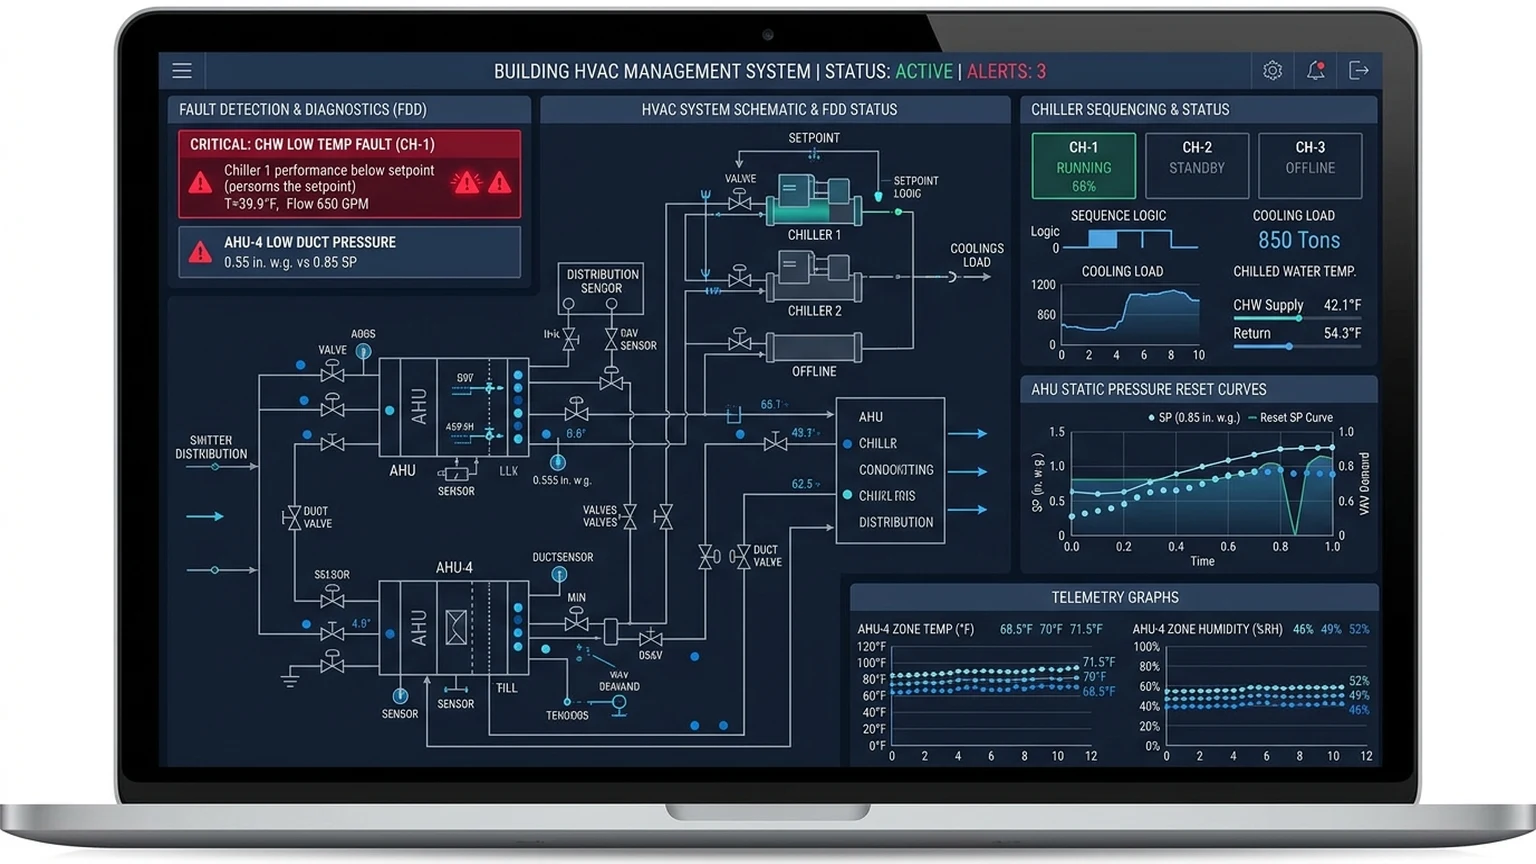
A phased engineering methodology to capture operational energy reductions in 30 days without disrupting facility operations:
Verify critical BACnet / Modbus data points, calibrate chilled water temperature sensors and pressure transducers, and log electrical meter intervals.
Eliminate schedule drift, synchronize occupied/unoccupied modes with actual tenant patterns, and expand heating/cooling deadbands.
Implement Trim & Respond static pressure resets and dynamic chilled water supply temperature resets according to ASHRAE Guideline 36.
Validate kilowatt-hour reductions against the pre-intervention regression baseline using IPMVP Option C methodology.
| Capability & Metric | Legacy BMS (Native Control) | Rule-Based FDD (Fault Detection) | AI Model Predictive Control (MPC) |
|---|---|---|---|
| Control Mechanism | Static PID loops & fixed setpoints | Continuous automated anomaly detection | Dynamic predictive setpoint optimization |
| Energy Savings Potential | Baseline (0%) | 10% – 20% | 20% – 35% |
| Hardware Requirement | Existing controllers | Software gateway & cloud analytics | IoT sensors, edge gateway & AI engine |
| Payback Period | N/A (Sunk cost) | 3 to 6 months | 6 to 12 months |
| Saudi Climate Adaptation | Manual summer/winter seasonal adjustments | Detects high ambient stress & valve hunting | Anticipates peak CDH & solar radiation |
Yes. Most enterprise optimization systems deploy non-intrusive edge IoT gateways that communicate via standard BACnet MS/TP, BACnet IP, or Modbus RTU. Legacy pneumatic zones can either be integrated via hybrid transducers or addressed first through primary plant optimization where the greatest energy density exists.
Commercial facilities in Saudi Arabia routinely achieve 15% to 30% reduction in total HVAC electrical consumption solely through automated fault detection, sensor recalibration, schedule enforcement, and dynamic ASHRAE Guideline 36 control sequence resets.
Fault Detection & Diagnostics (FDD) is an analytical surveillance tool that identifies when physical systems deviate from expected behavior (e.g. leaking valves or sensor bias). Model Predictive Control (MPC) is an active control layer that uses weather forecasts and thermal models to continuously calculate optimal setpoints hours in advance.
An initial telemetry audit and sensor calibration assessment typically takes 7 to 10 business days. Preliminary control resets and quick-win schedule corrections deliver measurable energy savings within the first 30 days of engagement.
Senior HVAC Controls & Building Energy Specialist | Windmason Arabia
Specializing in central chiller plant optimization, automated fault detection, and ASHRAE Guideline 36 high-performance control sequences across Saudi commercial, medical, and industrial infrastructure.
Our certified energy engineers inspect your BMS trends, sensor calibration, and control loops to unlock 15% to 35% kilowatt-hour savings with zero upfront capital expenditure.